Racing Camp Sumatanga RAAM-style, redux
This past Sunday was the training race series finale with a 100KM race ending with a steep 1 mile cat 3 climb to the top of Chandler Mountain. I had a four day block from the end of last week until Tuesday of this past week where I rode 586.9 miles with 73,087 feet of climbing. I had a pretty light load the rest of the week, and I wondered if I would be recovered enough for the race. It didn’t really matter, though, because the weather was absolutely beautiful and I was able to enjoy a shorts / short sleeved jersey ride all the way to the start of the race.
I’ve updated the topocreator.com elevation profile using a higher resolution dataset to get the full 3005 miles of the course. Plus, I turned on the box gradient feature. The box gradients are drawn into the profile and show ALL climbs and descents of at least 1 mile in length and a 5% average grade. Inside the box is the exact length of the 5% section of the climb, the exact grade, and the vertical difference between the start and end of the climb (or descent). Click on the image below for a 8500 pixel version of the profile. Your browser will probably load the image in a window by itself and then scale it down to fit on the screen. You may need to click on the image itself again to zoom in to see full detail.
To get this to work, I rewrote the entire algorithm in Java so that it could run on a real machine rather than the virtual machine hosting the web server. The profile creation took only a matter of a couple of minutes … most of which was transferring the megabytes of data back and forth between the web server and my home system.
Wow, it took a lot of computing power, but this morning the elevation profile I had started for RAAM yesterday finished. Part of the reason it took so long is that my algorithm scans for the highest and lowest point as well as all gradients along the route greater than 5%. This may not sound too difficult, but finding the exact starting and ending points of a hill allowing for smaller downhills to be included in the hill if the general slope is still up … is very difficult. To make it feasible, I had to filter the entire route down to 5000 data points or roughly one data point every km which is why the total length is shortened by almost 45 miles. So it looks like the total climbing for RAAM will be somewhere in the neighborhood of 150,000 feet of climbing for the 3005 mile route or roughly 4 times flatter than my normal riding. The profile below doesn’t show the gradients because I thought it would be too hard to see them so I checked “hide gradients”, which still does the calculations but doesn’t draw them on the map. Hopefully, I’ll have an updated version by tomorrow that has what I call “box gradients” — i.e., a box drawn around the climb with the vertical diff and average gradient.
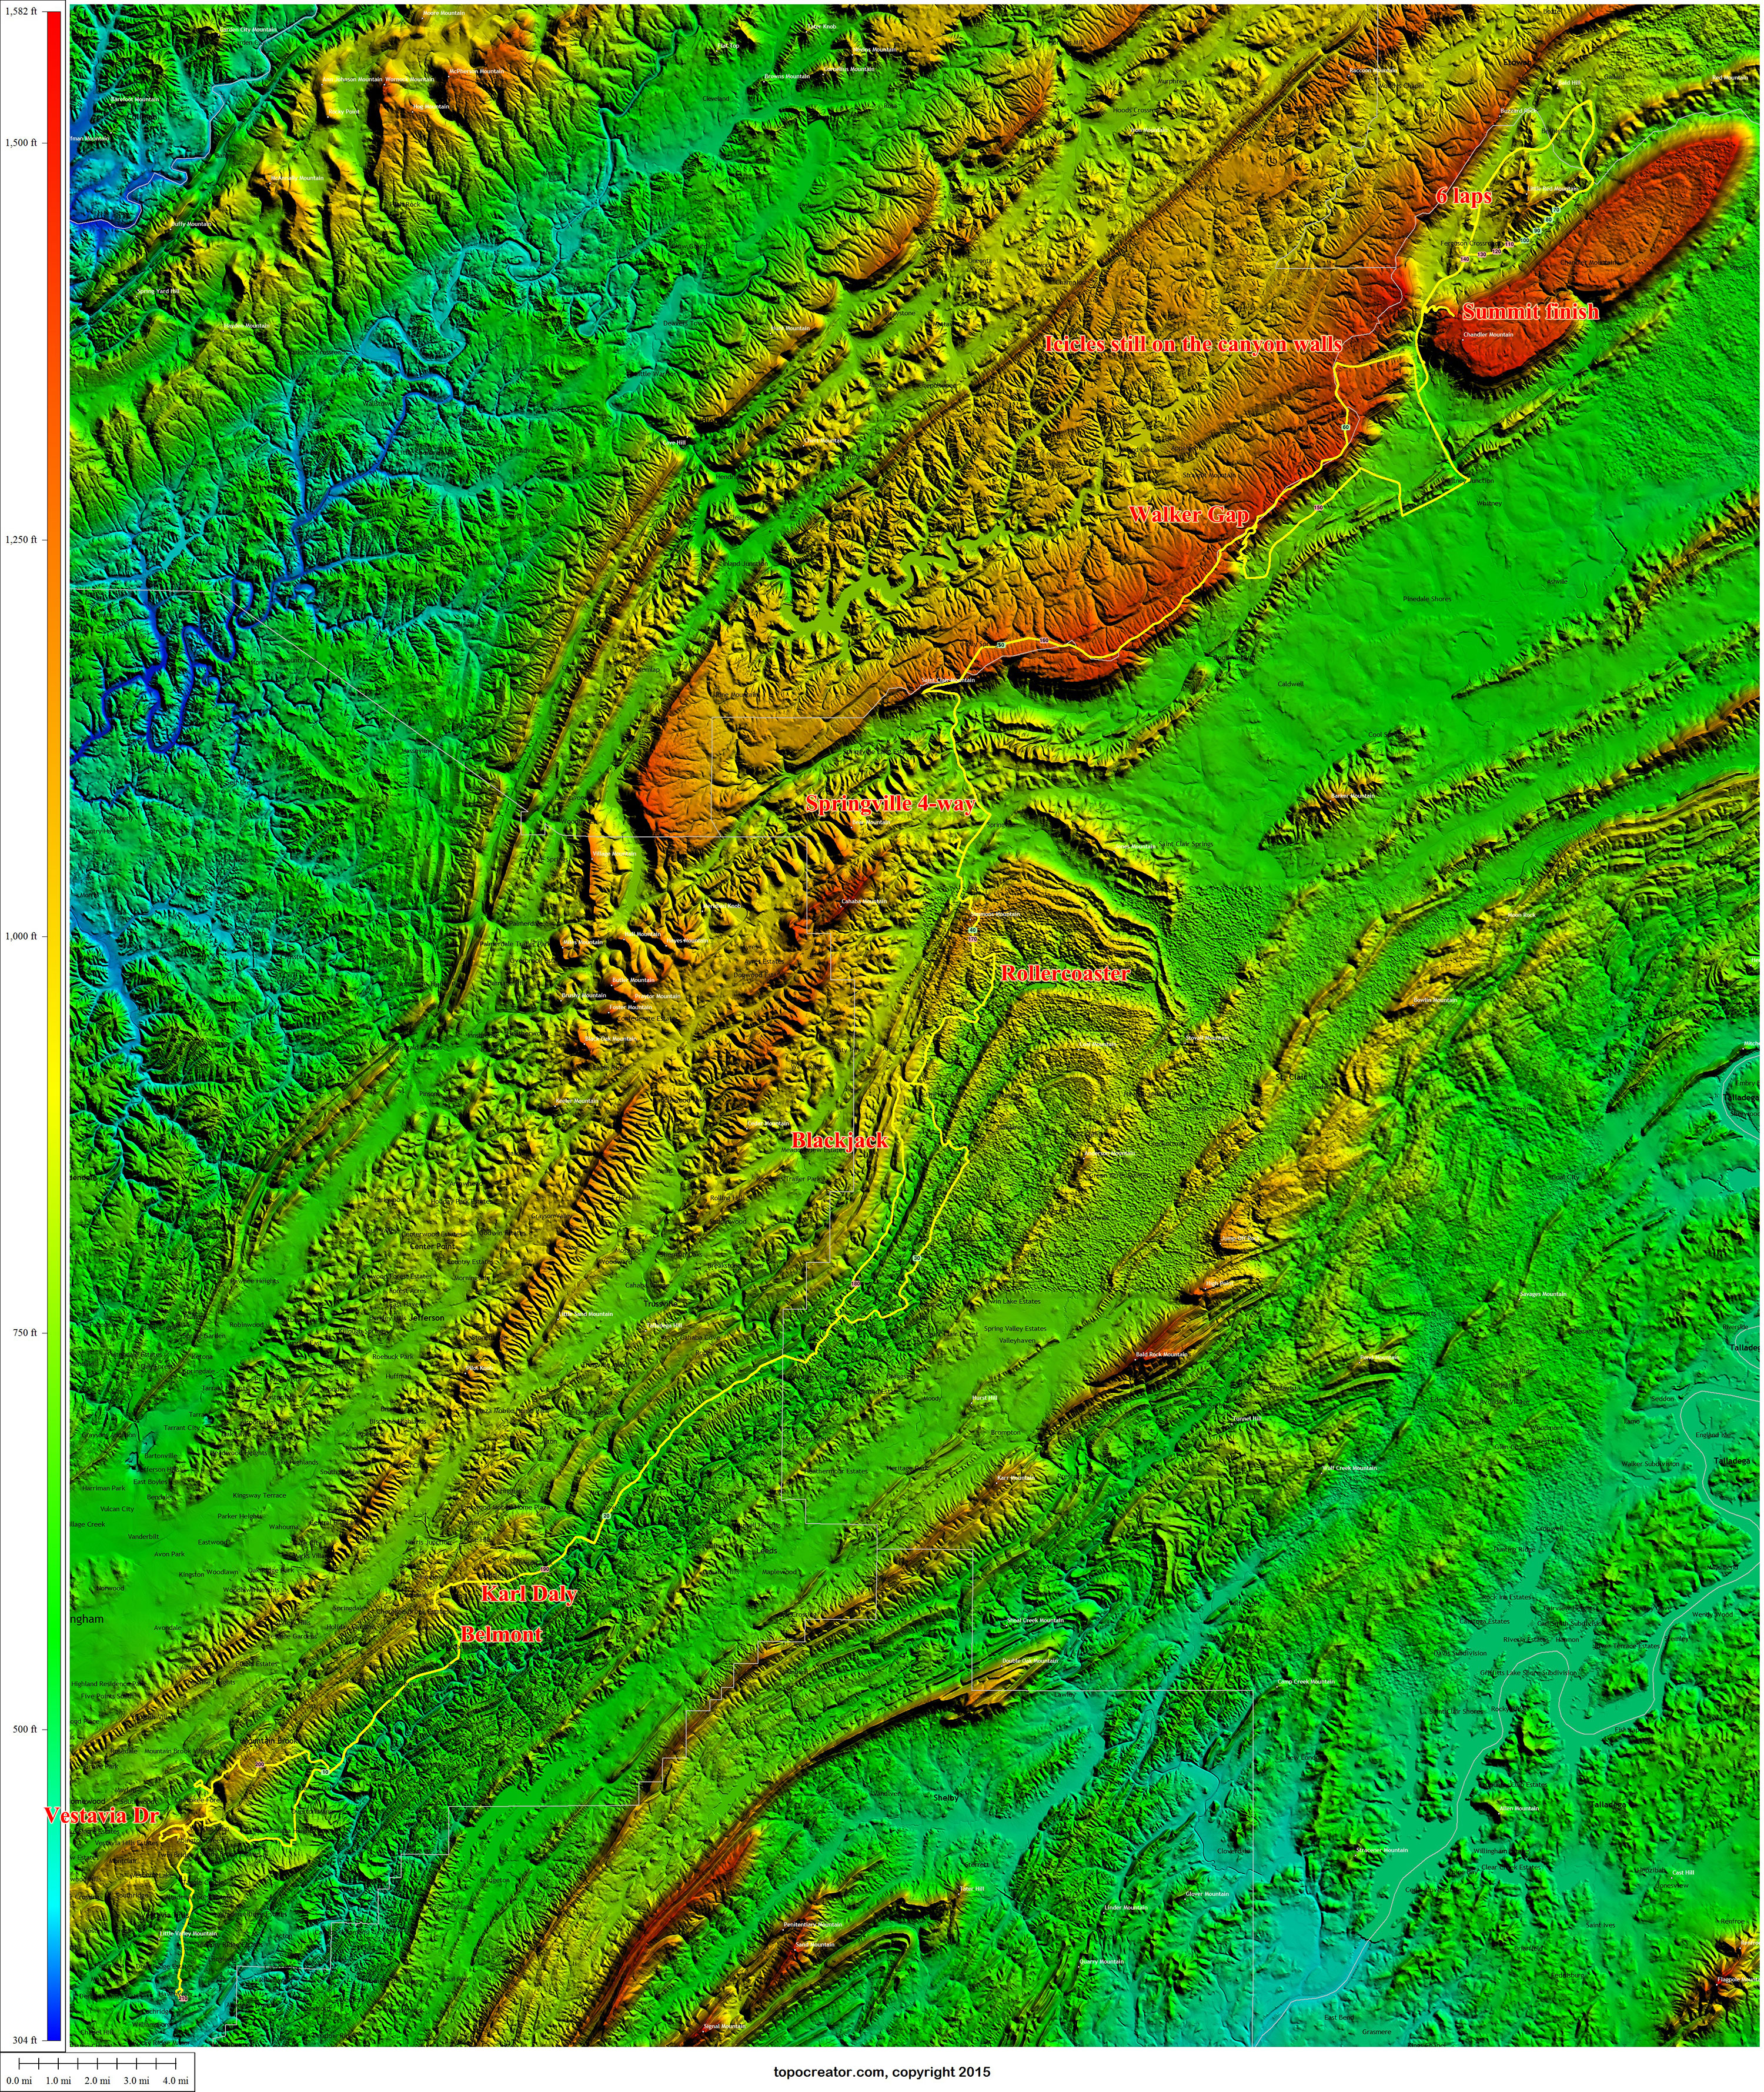 Annotated topocreator map of the race and the route there and back again (click to enlarge).